Research note · 6 Aug 2026 · synthetic PaySim data only · English
From raw events to a deployed decision system
This is a public, synthetic demonstration of the delivery method: define a pre-decision data contract, split evidence chronologically, compare models at a fixed review framing, freeze an artifact, deploy it, and expose versioned live inference. The reported performance belongs only to the simulator; the engineering and evaluation pattern is what MIHZI would rebuild on approved customer data.
Synthetic data only.
Nothing here is your production traffic, and nothing here is a promise about accuracy on a real wallet, bank, insurer, clinical, or logistics system.
When we work with you, we rebuild and recheck on your data.
What this proves: chronological evaluation; fixed-workload thinking; simple features before complex history; a frozen deployable artifact; live versioned inference with observable identity.
What this does not prove: production performance for any operator; coverage of SIM-swap, device, agent, or social-engineering signals; calibrated real-world probability; clinical or industrial validation; that thresholds transfer to another organization.
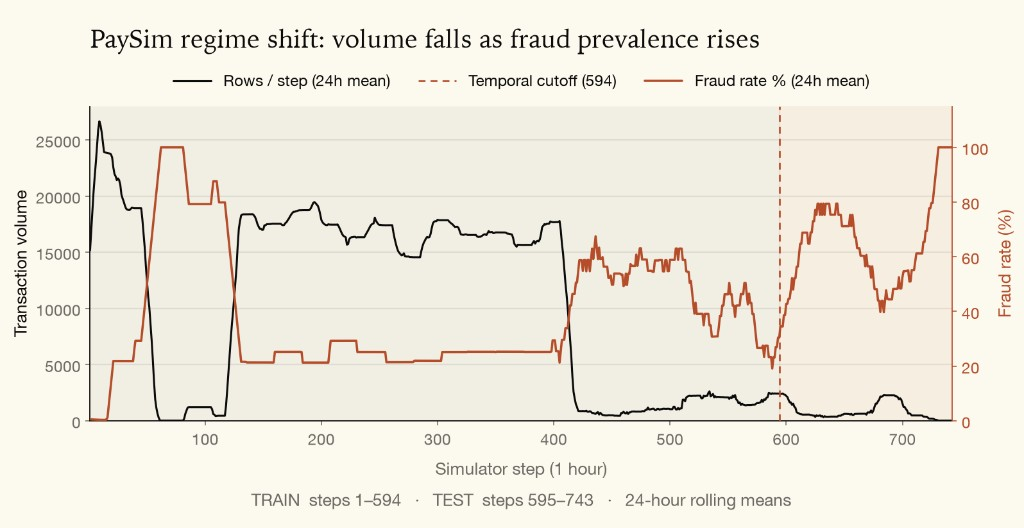
In this simulator, volume falls and the fraud rate gets noisier later on.
So we train on earlier hours and test on later hours.
That is closer to real life than shuffling the whole file.
On your data, the same idea applies: train on the past, check on what came next.
If future weeks look different, a shuffled test can make a model look better than it is.
Simple fields already carry signal
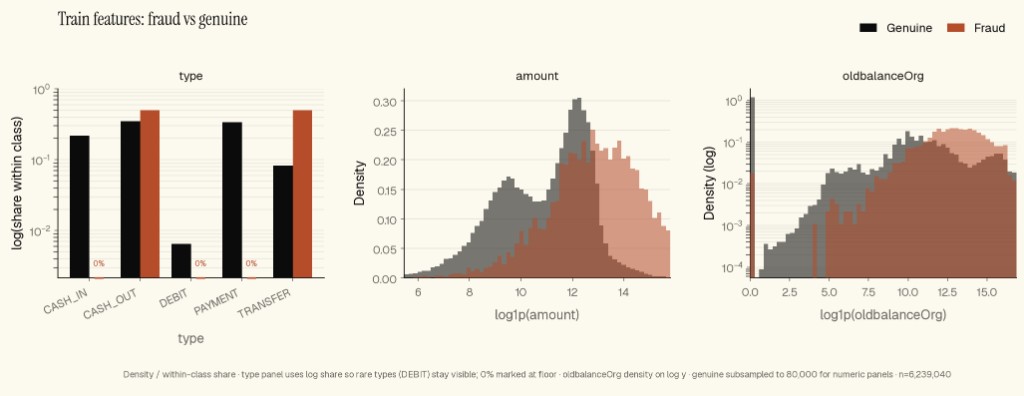
Synthetic training window: type mix, amount shape, origin balance shape
Before any fancy history features, a few basic fields already separate many fraud rows from genuine ones.
In this simulator, fraud shows up in cash-out and transfer. Amounts and balances look different too.
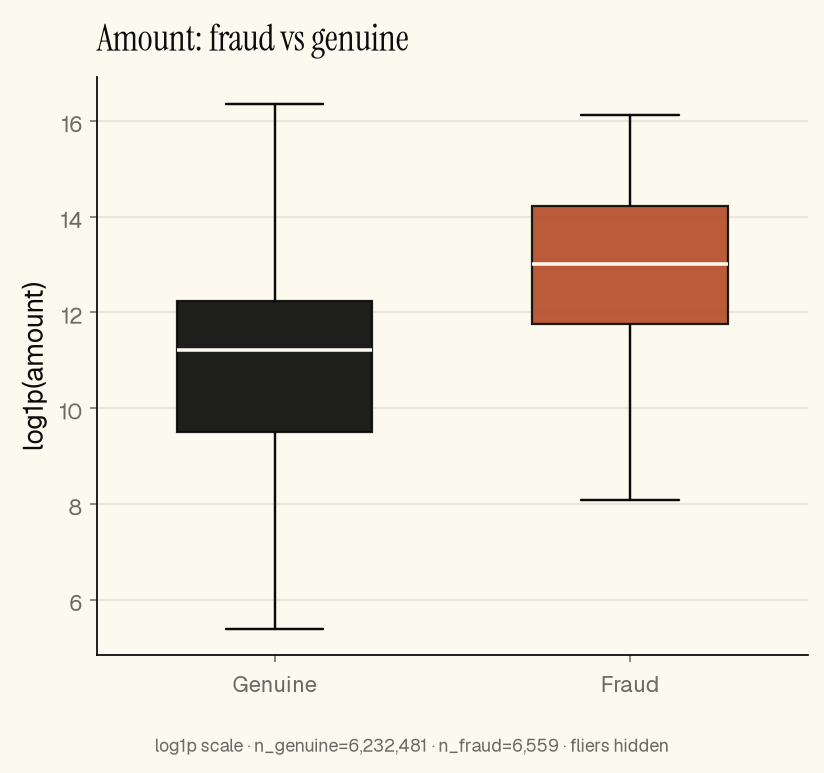
Synthetic amounts: fraud tends higher than genuine on this data
That does not mean “large equals fraud.”
It means your first model can often start with fields you already store, then grow as your labels and history improve.
Some tricks look great and still mislead
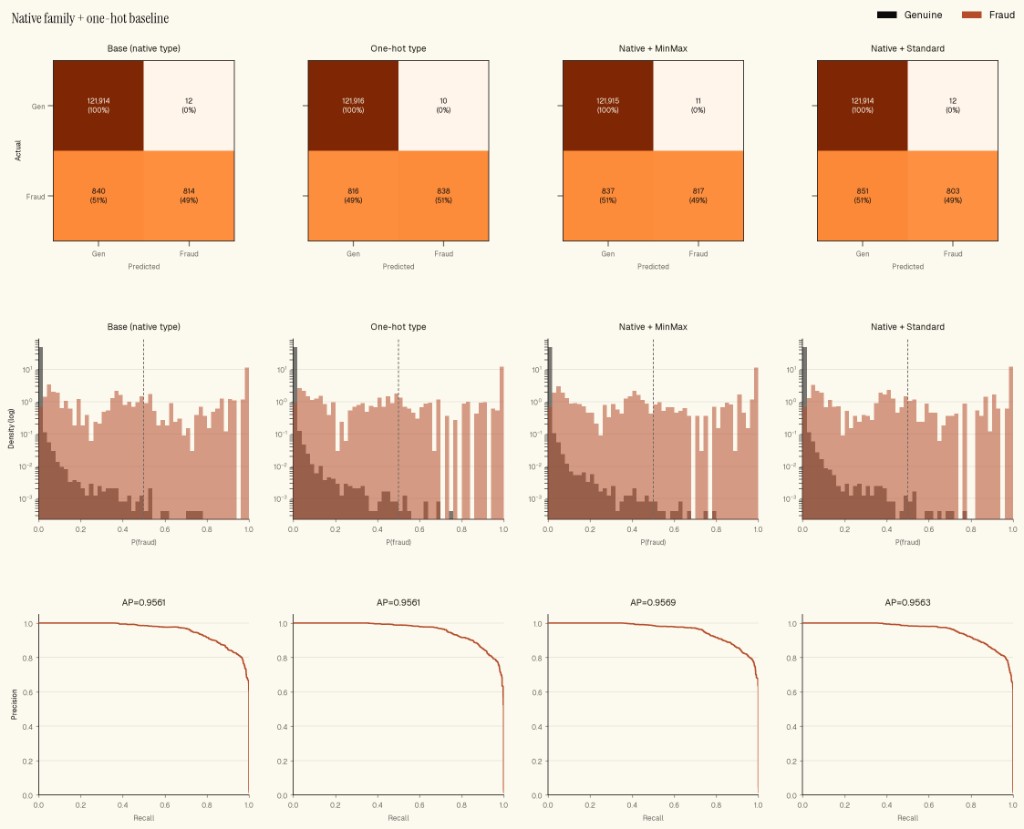
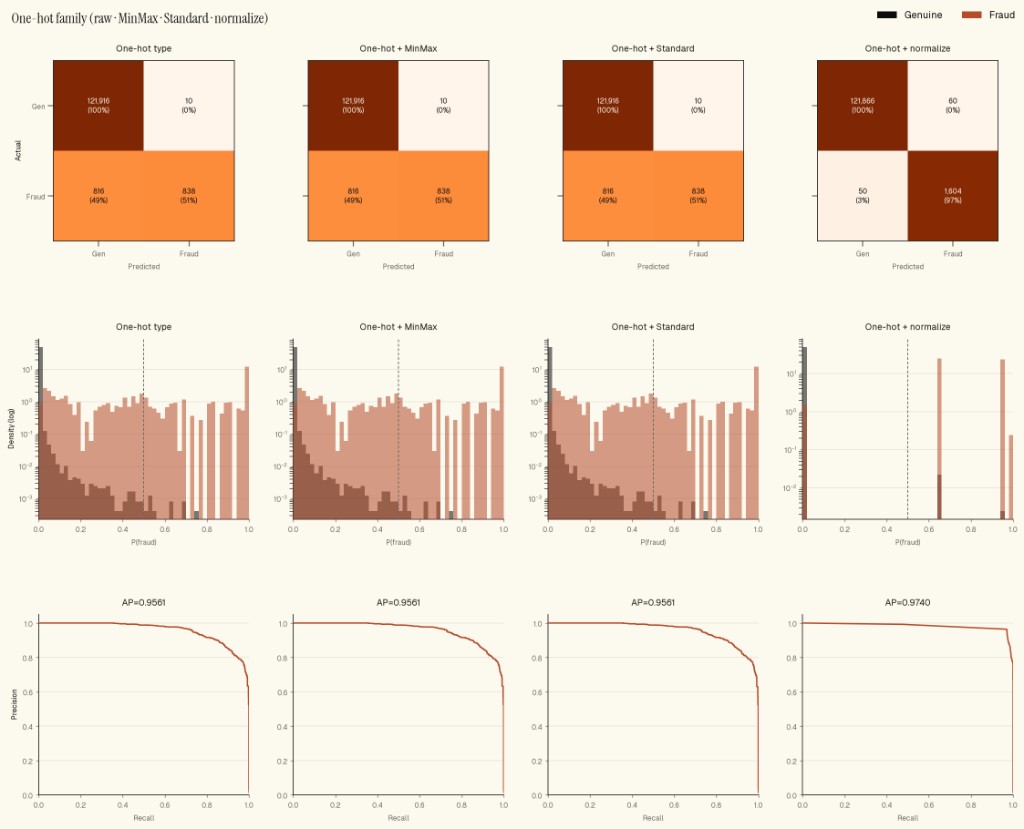
Synthetic bakeoff: normal setups keep a spread of scoresSynthetic bakeoff: one setup collapses scores into a few spikes
One transform made the model look much stronger because many fraud rows in PaySim drain the whole balance.
The model basically learned a yes/no flag from the simulator.
On your data, “moved most of the balance” can still matter.
It is rarely that clean.
We keep the useful idea and reject the easy win that only works because the fake data is too neat.
From model choice to model explanation
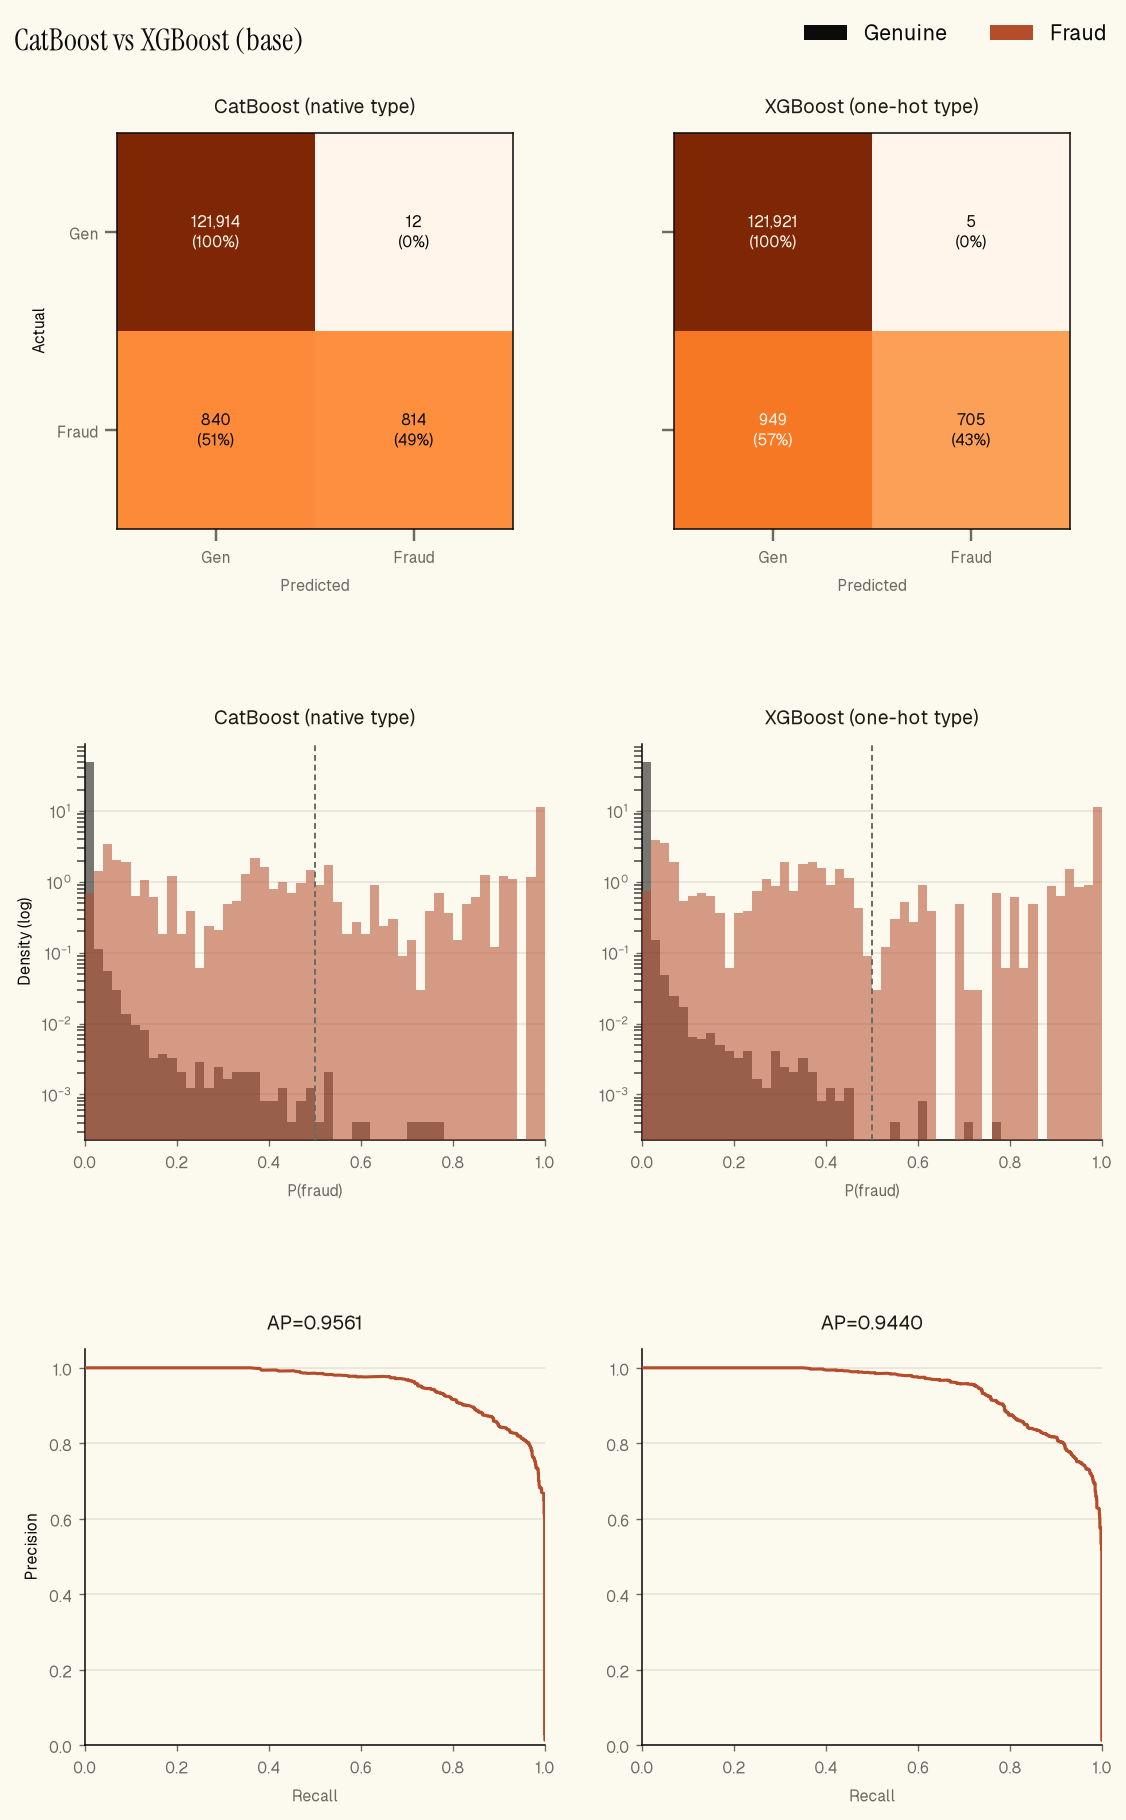
We compared two boosted-tree base learners on the same three pre-transaction features and a later chronological hold-out.
CatBoost produced higher average precision and recall at the illustrative 0.5 threshold, while XGBoost produced slightly higher precision.
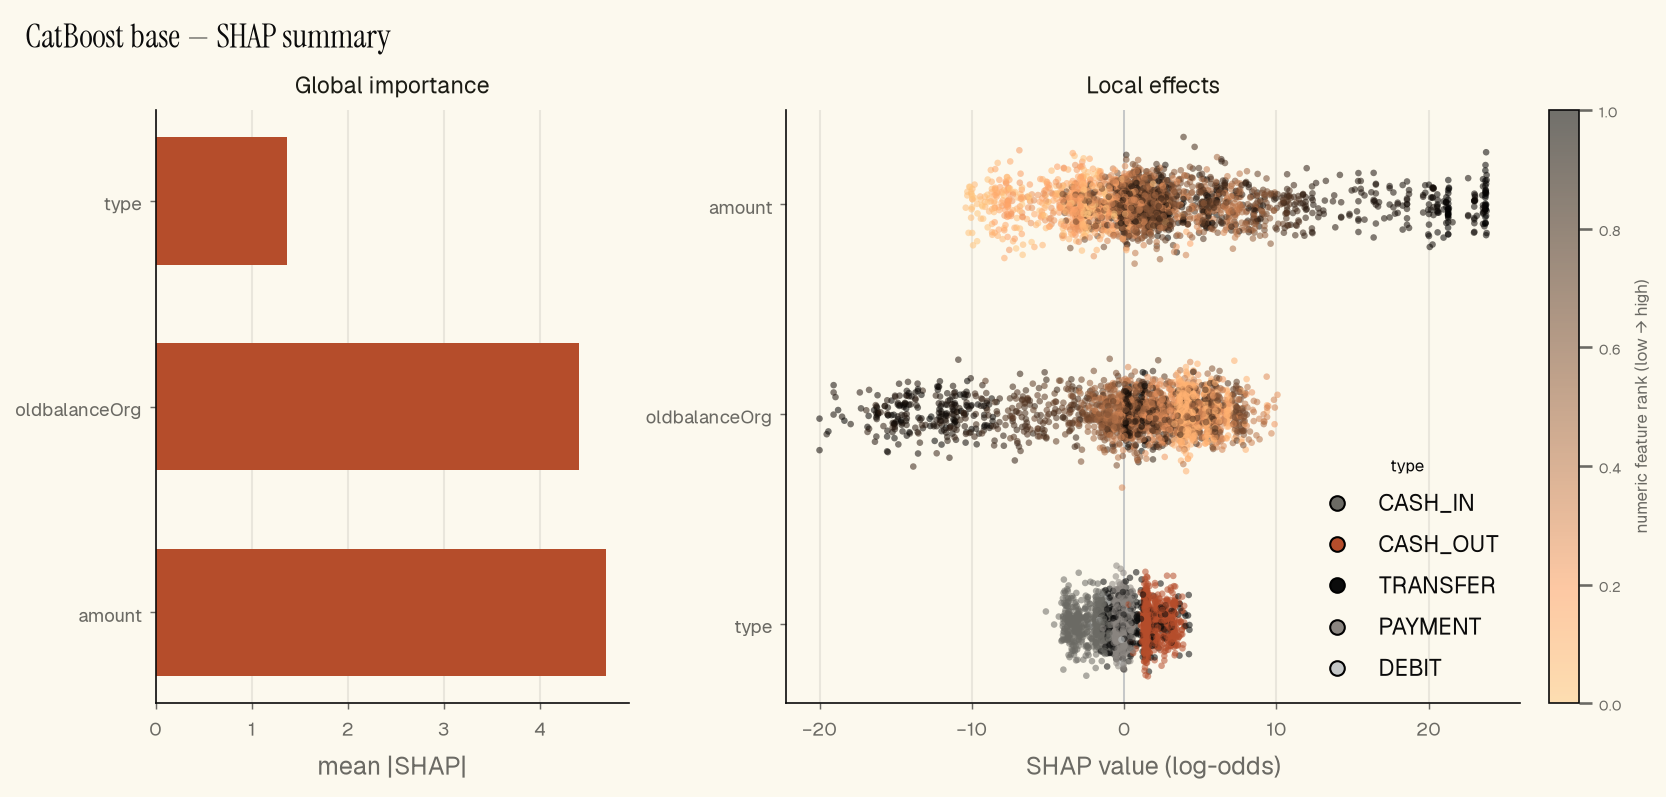
We then used CatBoost's native SHAP calculation to inspect which inputs moved its score.
This is synthetic experimental evidence, not a claim about production performance or a customer's data.
Same inputs, different categorical handling. CatBoost uses transaction type natively; XGBoost uses one-hot encoding. On PaySim steps 595–743, CatBoost achieved 0.956 average precision versus 0.944 for XGBoost. At a 0.5 threshold, CatBoost recovered more synthetic fraud with a small precision trade-off. Thresholds for a real service would be chosen against review capacity, error cost, and policy—not copied from this experiment.What moved the CatBoost score. Native SHAP values on a stratified 10,000-row chronological-test slice show amount and origin balance with the largest global attribution magnitudes (mean |SHAP| about 4.69 and 4.41; type about 1.37). Values are log-odds contributions inside this fitted synthetic model; they are not percentages, direct probability changes, causal effects, or proof of a transferable real-world fraud mechanism.
Live demo reason_codes are separate heuristic explanations, not these SHAP values.
See the model card for the deployed paysim-catboost-demo-v1 digest and limits.
See the method, then test one decision with your data
The demo workbench shows a simulated review queue beside a live synthetic scorer.
You can confirm fraud or not fraud the way an analyst would; that feedback does not retrain the model.
Tell us one repeated decision. We will respond with the smallest useful data checklist, the evaluation boundary, and the measure we would use. No production data is needed for the first conversation.
Payments and fraud are one example. The same pattern fits operations, forecasting, claims, logistics exceptions, governed clinical research partners, and data foundations.